Stock Cli Tracker with Nodejs and Yahoo Finance
| 3 minutes read
Why I built myself a share CLI tracker?
Here is why
I was tired of checking my account regularly to see how stocks were doing. Yes, I know, invest passively and don’t check. But I’m too curious about that. I don’t sell my shares, I rarely buy more, actually always according to my plan anyway, but I still keep checking. Simply because I’m interested in how things are looking at the moment.
But I don’t want to log in to Trade Republic or comdirect all the time to see what the situation is. But I would just like to have a little graph and see what the price is at the moment. So I just built this.
Here you can see how.
Getting Started
First, I looked for simple APIs that show me the price of an ETF. Many recommended yahoo finance, some google. But I did not find a simple and free API. Only this Nodejs package, which is written in JavaScript. Here it seemed easier to me to just quickly rewrite the code in TypeScript than to type the library.
Code
No sooner said than done. So I copied the two functions I need and typed them:
import axios from 'axios';
import { HistoricalPrice, StockPrice } from '../models';

const BASE_URL = 'https://finance.yahoo.com';

const getCurrentData = (ticker: string): Promise<StockPrice> => {
  return axios
    .get<String>(`${BASE_URL}/quote/${ticker}/`)
    .then((data) => {
      const content = data.data;
      let startPosition = content.indexOf(`"${ticker}":{"sourceInterval"`) + `"${ticker}":`.length;
      let index = startPosition;
      let bracketsCounter = 0;
      for (let i = index; i < content.length; i++) {
        if (content[i] === '{') {
          bracketsCounter++;
        }
        if (content[i] === '}') {
          bracketsCounter--;
        }
        if (bracketsCounter === 0) {
          index = i;
          break;
        }
      }
      try {
        const result: StockPrice = JSON.parse(
          content.substr(startPosition, index - startPosition + 1)
        );
        return result;
      } catch (error) {
        return Promise.reject(`Could not parse data for ${ticker}`);
      }
    })
    .catch((error) => {
      return Promise.reject(`Could not load data for ${ticker}`);
    });
};
The code can be found here. I typed the second function, but I don’t need it.
The next step was to show the whole thing as a table and as a graph in the terminal. For the table I used cli-table, for the graph asciichart. I am very satisfied with the result, even though the code can certainly be simplified and improved.
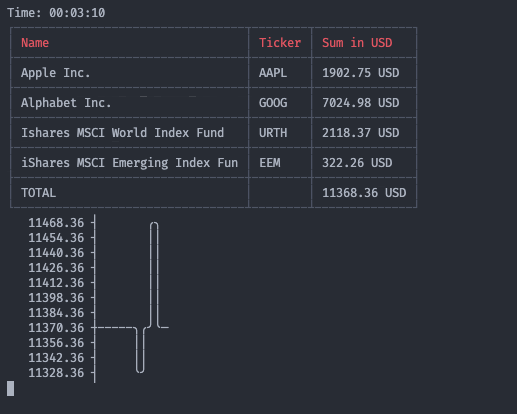
I always start it with the following command yarn dev -c config.csv -t 600 -l sum.csv.
The config looks like this:
AAPL,15
GOOG,3
URTH,17
EEM,6
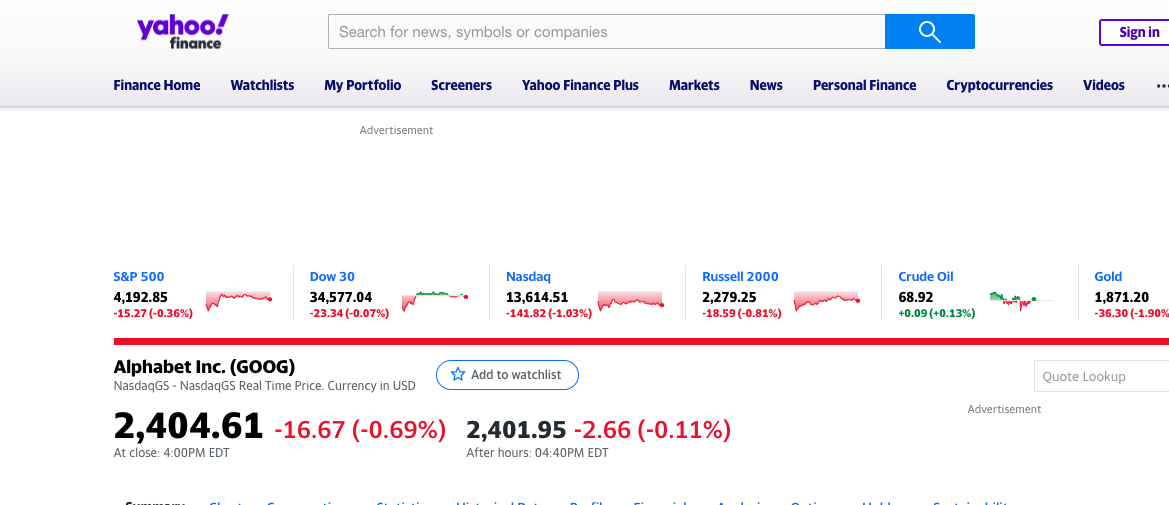
The first column is the code you find on yahoo finance and the second column is the number.
The code on finance is the one in brackets after the company name:
Conclusion
I hope the tool helps you to track your shares. But as Gerd Kommer says in the book Souverän investieren mit Indexfonds und ETFs, set up a plan and stick to it. So don’t let the tool lead you into gambling.
The code is available on GitHub as usual.